
Visibility
Limited visibility into 3P market performance
Third-party sellers are rapidly disrupting both Amazon and Walmart. Without a clear view of 1P AND 3P performance, brands miss early threats and growth opportunities.
Parable is the deepest source of truth on Amazon and Walmart — market share, pricing, demand, search, advertising, Buy Box and competitor moves, all backed by 10+ years of history. The full picture of both marketplaces, in one place.
They set the standard for global e-commerce — but cutting through the noise to find meaningful insight is a constant battle.
Third-party sellers are rapidly disrupting both Amazon and Walmart. Without a clear view of 1P AND 3P performance, brands miss early threats and growth opportunities.
Most brands lack a unified dataset to analyze competitors at the brand AND product level — across BOTH marketplaces. That data gap makes it impossible to benchmark, refine pricing, or find whitespace.

Without accurate revenue and sales estimates spanning a decade, product selection becomes guesswork. You can't prioritize SKUs, optimize inventory, or capture emerging trends with confidence.
Brands that win on Amazon and Walmart don't react — they anticipate. Parable gives you a decade of historical depth and the forward-looking signals to spot demand shifts, defend share and invest ahead of the market. No one else combines both marketplaces with this much history and this much foresight.
Internal sales tell you what happened to you. Marketplace data tells you what happened to the market — the only way to know if you actually won, or just rode a rising tide while a competitor quietly took share.
A decade of pricing, demand and share history turns hindsight into foresight. Spot structural shifts months before competitors, time launches to seasonality, and price with conviction instead of instinct.
Search momentum, emerging keywords, new entrants and pricing pressure surface tomorrow's winners early — so you launch, defend and invest before the rest of the category catches on.
Built on a decade of Amazon and Walmart data you won't find anywhere else. Talk to us to see what's hiding in your category.


Whether you sell on one marketplace or both, Parable gives you the depth and history to outpace every competitor.
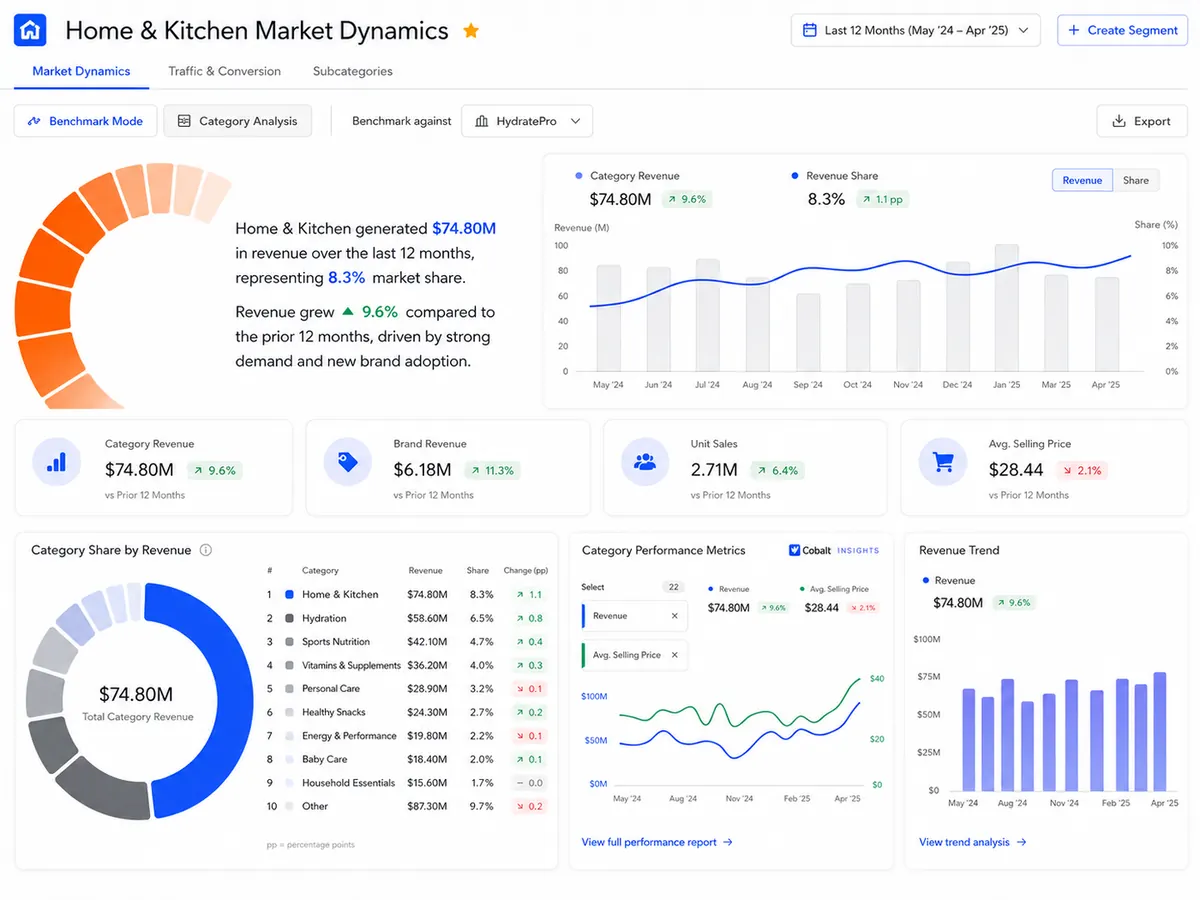
Win your market — and keep it. Sales alone don't tell the full story: if your brand grew but the category grew faster, you actually lost ground. Parable puts performance in context with the most accurate Amazon and Walmart share data available — quantify true brand vs. market growth, benchmark competitors, spot new entrants before they erode your position, and prioritize pricing, assortment, innovation and ad spend where it actually moves share. Track every movement in real time across category, brand and SKU/Item level.
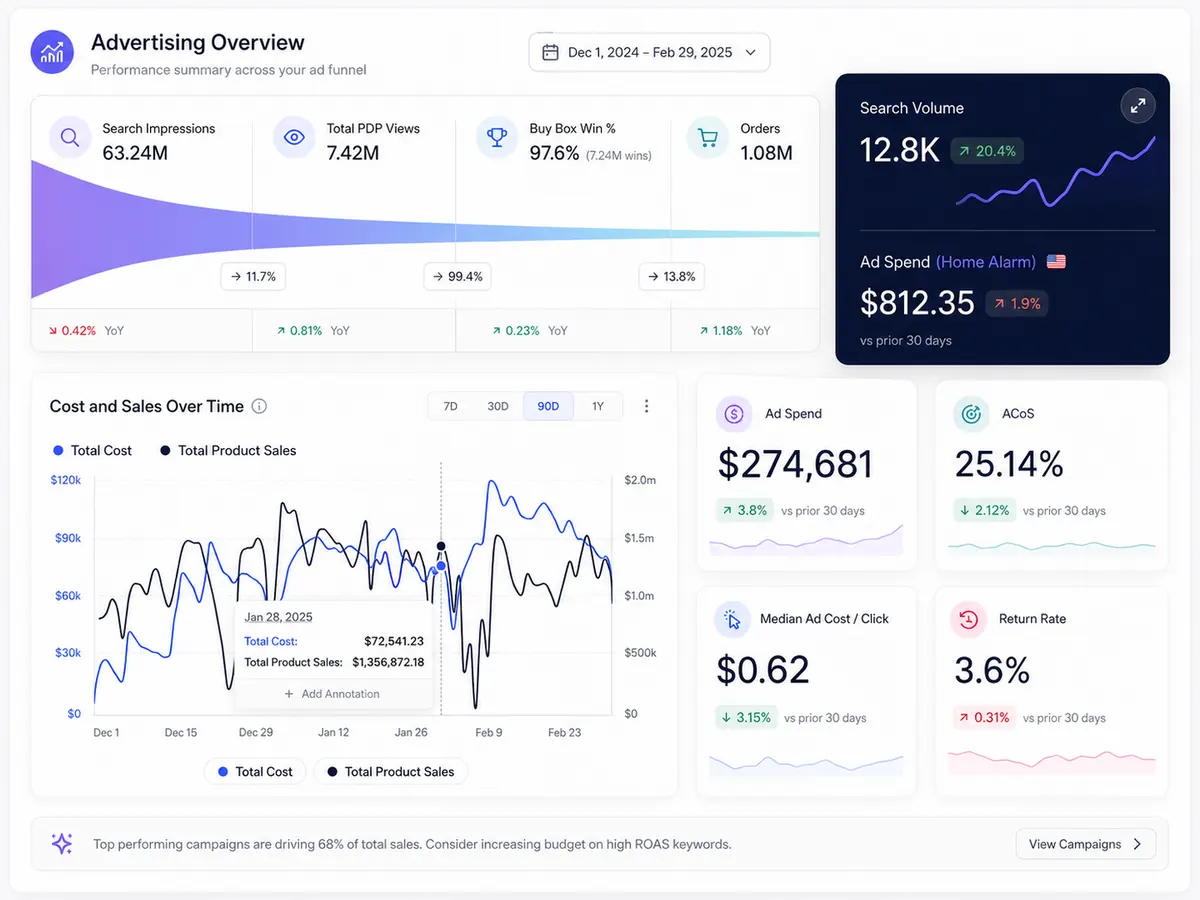
Make every ad dollar work harder on Amazon and Walmart. Six built-in automations — Dayparting, ROI Optimization, Sales Maximization, Shelf Planning, Keyword Harvesting and Advanced Budget Control — protect performance, kill wasted spend, and keep your campaigns aligned to true market-share growth.
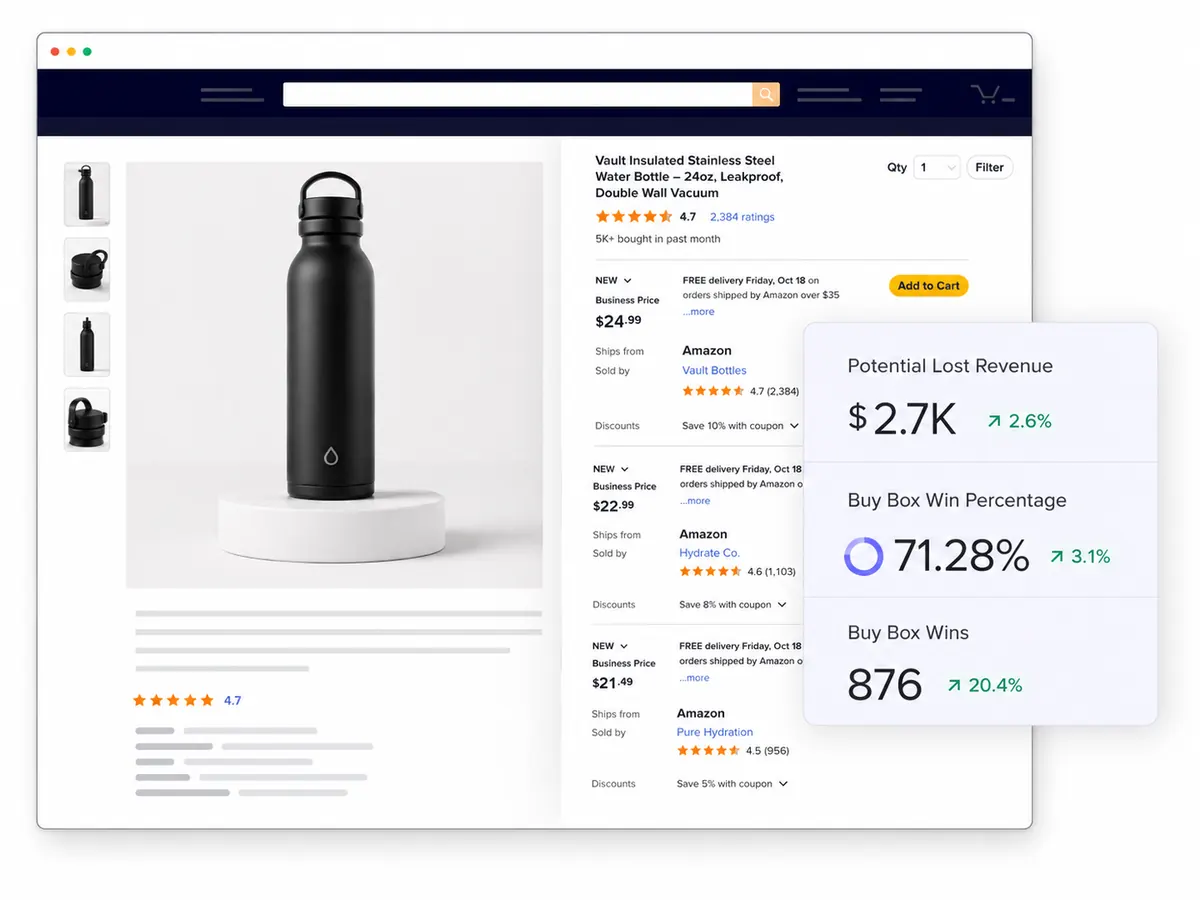
Protect your Amazon listings — and your revenue. Shifting prices, new resellers and unauthorized listings can erode visibility overnight. Parable gives you complete Buy Box, seller and pricing intelligence — from seller-level detail and fulfillment methods to real-time pricing trends, MAP violation alerts and the full landscape of competitive offers — so you can defend brand integrity, win the Buy Box and keep pricing consistent across every ASIN.
Grow revenue with data-backed products. Understand Amazon through consumer demand, whitespace and innovation — find unmet demand before competitors, validate pricing and positioning before launch, and track how trends, competitors and shopper behavior shift in real time. Parable's top brands grow 3× faster by launching 2× more new products, powered by keyword research, market segments and custom dashboards that surface where to invest next.
Compare against true category competitors — not generic averages. Diagnose whether a sales dip is you or the market.
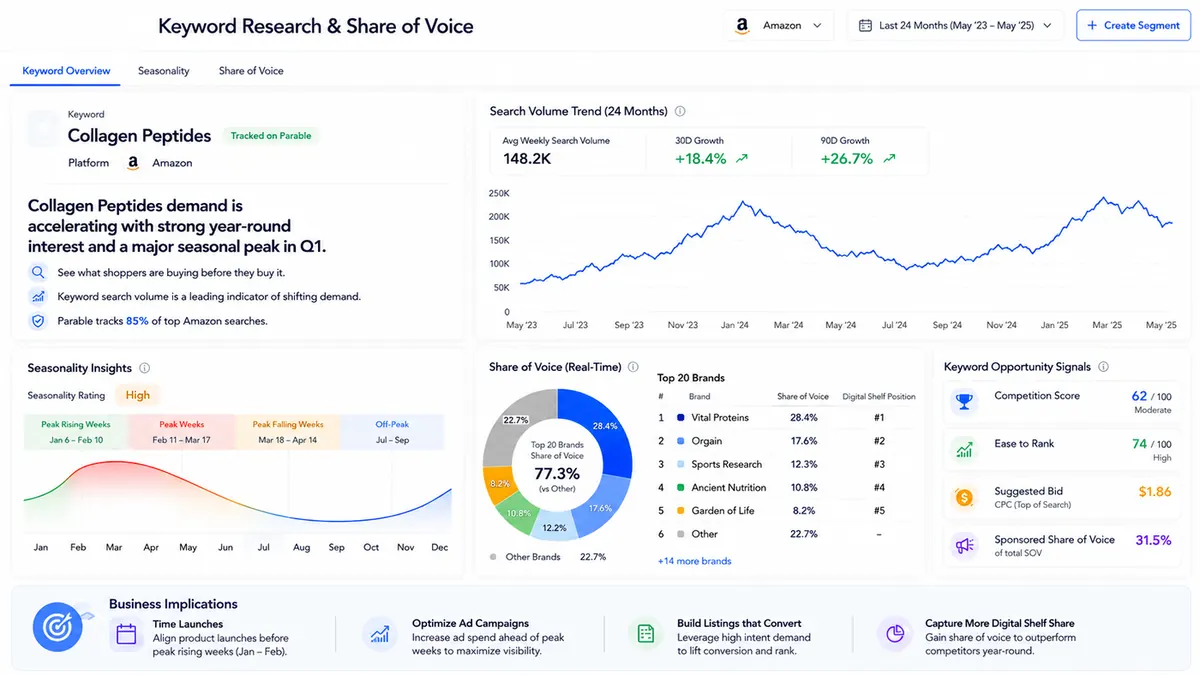
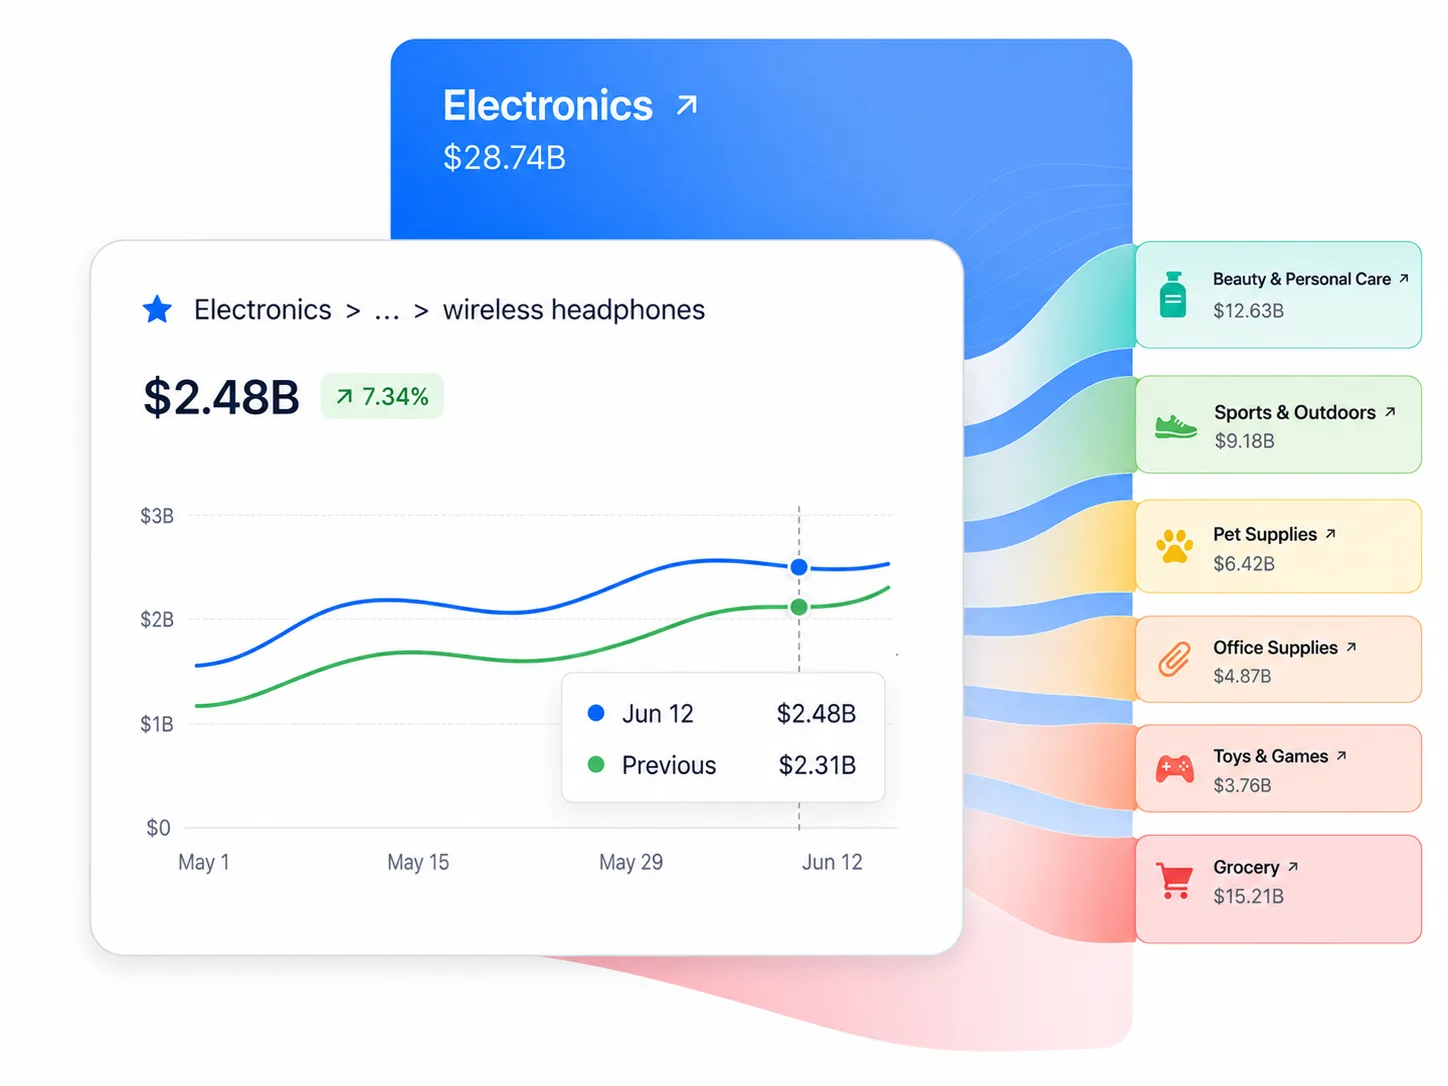
See what shoppers are buying before they buy it. Keyword search volume is a leading indicator of shifting demand — Parable tracks 85% of top Amazon searches with weekly volume, 30/90-day growth rates and two years of history so you can separate lasting opportunities from short-term spikes. Pair seasonality ratings and peak-rising/peak/peak-falling weeks with real-time Share of Voice across the top 20 brands per keyword to time launches, optimize ad campaigns, build listings that convert and capture more of the digital shelf year-round.
Track market trends, optimize pricing, accelerate ad performance, and own the digital shelf — all in one platform, across Amazon and Walmart.
Unlock category insights to optimize pricing, product mix, and innovation. Refine channel strategy and strengthen pricing power with competitive intelligence and demand forecasting — across Amazon AND Walmart.
Unify Amazon and Walmart data into expert-curated dashboards for fast, actionable insight. Monitor sales, optimize pricing, track performance, and launch innovative products faster.
Automate PPC across both marketplaces to save time and budget. Optimize CTR and CPC, eliminate wasted ad spend, and maximize ROI with data-driven recommendations.
See how your brand stacks up with share-of-voice insights. Track rankings, uncover high-performing keywords, improve search visibility, and own the Buy Box.
Without high data accuracy, you risk investing in the wrong place — compounding over time and putting revenue at risk.
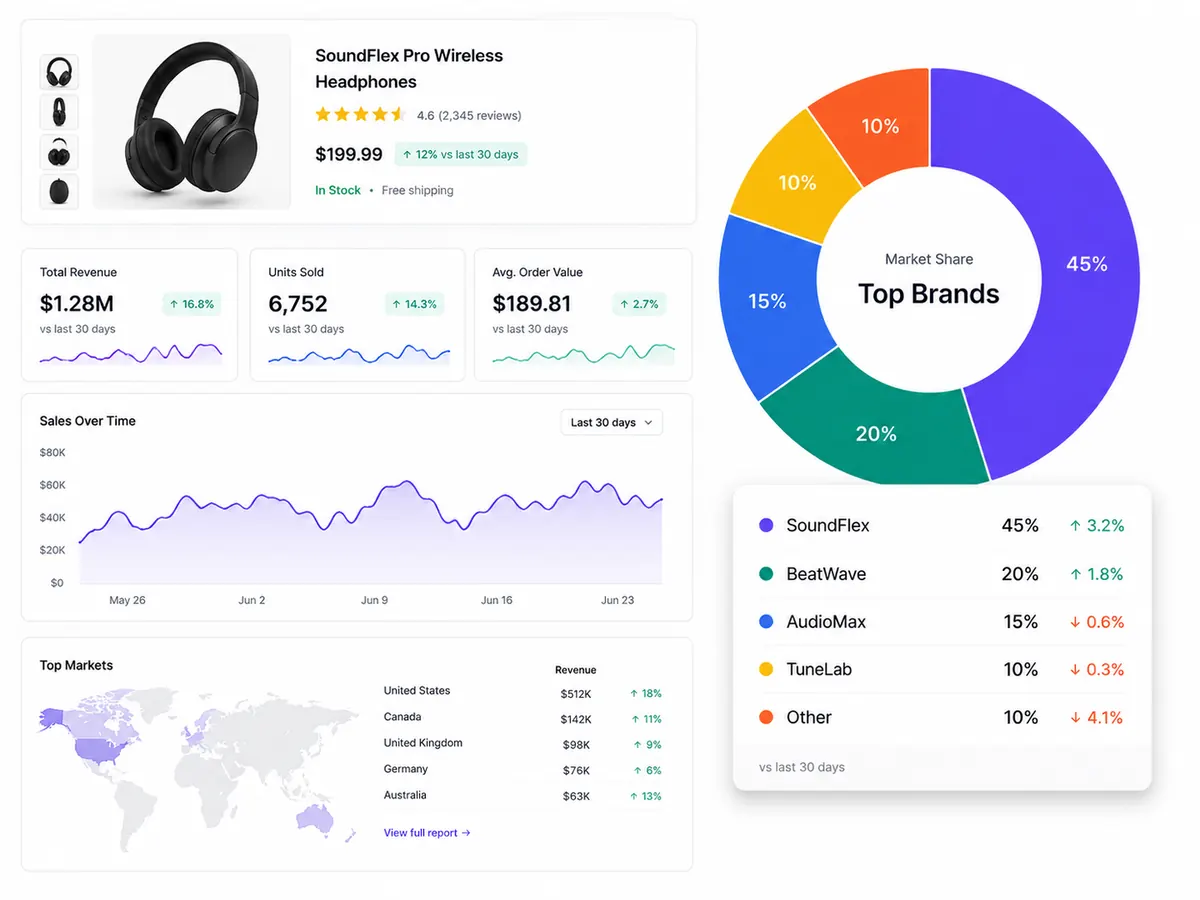
From category revenue mix and Buy Box conversion to keyword momentum and competitor pricing — every chart is powered by 10+ years of Amazon and Walmart data.
Average revenue growth across Amazon & Walmart for active Parable brands.
Both Amazon and Walmart — unified into a single market share view, with 10+ years of historical depth on each. We're the only platform that gives you true cross-marketplace category, brand, and ASIN/Item-level intelligence.
Over 10 years of clean, normalized marketplace data — the longest history available in the industry. Use it to separate seasonality from structural shifts and to model demand across full market cycles.
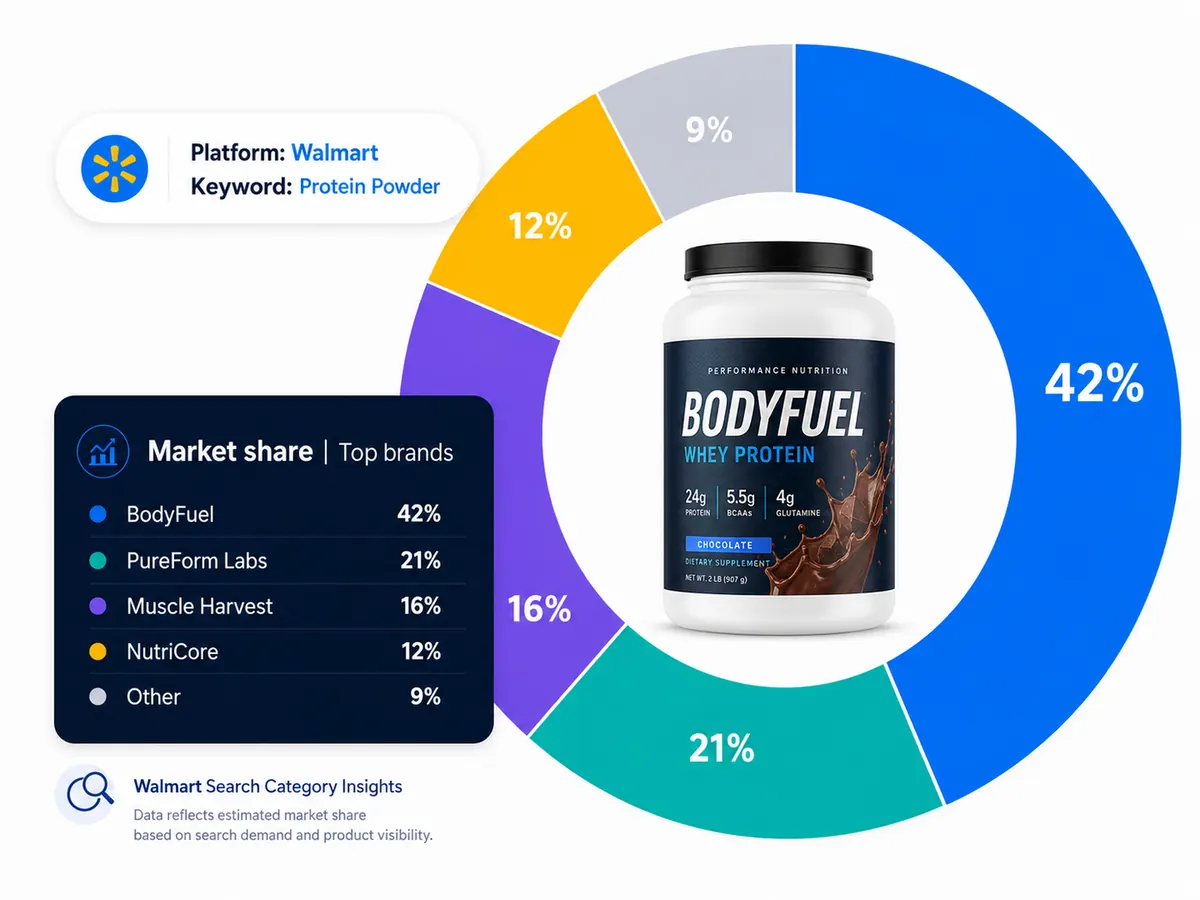
Parable compares your brand to the overall market and to your true competitors — by category, subcategory, brand, SKU, and keyword. Measure share, sales, pricing, Buy Box wins, share of voice, and more across both Amazon and Walmart.
Yes. We diagnose whether the slowdown is driven by shopper demand shifts, competitor activity, pricing pressure, lost Buy Box, unauthorized sellers, or your own product mix — across both marketplaces.
Parable surfaces whitespace, validates demand, tracks emerging keywords and seasonality, and shows where competitors are leaving room to launch — backed by a decade of category history on Amazon and Walmart.
Track Buy Box win rates by category, brand, and SKU. Monitor seller-level detail, pricing, fulfillment, and MAP violations. Identify unauthorized 3P sellers eroding revenue and quantify potential lost revenue.
Yes. Parable Ad Accelerator automates Amazon and Walmart PPC with dayparting, ROI optimization, sales maximization, shelf planning, keyword harvesting, and advanced budget control — tied directly to market share outcomes.
More depth, more history, and true cross-marketplace coverage. Most tools cover Amazon only and a few years of data. Parable covers both Amazon and Walmart with 10+ years of context, 600M+ products tracked, and the broadest keyword coverage in the industry.
We've spent over a decade refining sales-estimate algorithms across orders, shipments, Best Seller Rank, inventory, pricing, categories, and subcategories — continually updated at the category level with advanced machine learning.
Sales estimates, pricing & price-band analysis, reviews & sentiment, brand & market share, BSR, variant child SKUs, seller (1P/3P) detail, search volume & seasonality, share of voice, Buy Box performance, and more — across Amazon and Walmart.
(with the best-in-class data they use.)
Get a sales demo